[Feedback][Tutorial Contents][Welcome Page]
![]()
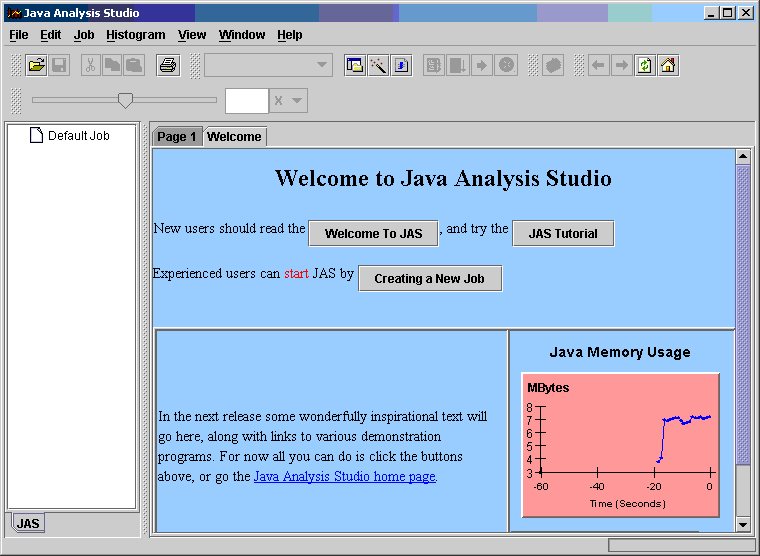
These instructions assume that you have already successfully completed tutorial 1, Installing JAS. Once you have started JAS you should see a window that looks something like this.
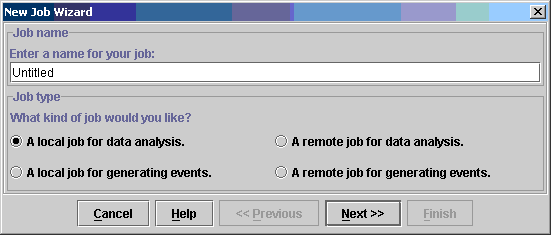
The first thing to do is to create a "Job". To do this choose "New Job" from the Job menu. In the dialog that appears choose a name for your job, and select "A Local Job for Data Analysis" and then click next.
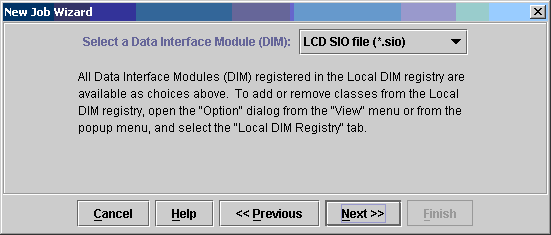
Next choose SIO File. (The LCD experiment uses both .sio files (slow serial IO files) and .lcd files (fast random-access files) to store simulated data and .stdhep files to store MC generated data. The CD contains only .sio files and .stdhep files.)
Use the browse button, navigate to the CD, into the Data/Full Simulation/SD directory, and open a file that takes your interest.
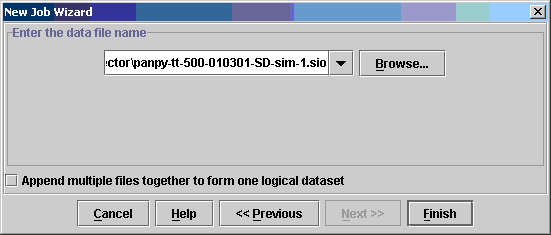
Now press finish and your file should be opened.
You have now created a job and opened a dataset. Next you want to load up the LCD specific extensions..
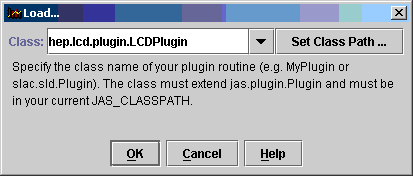
From the "Job" menu choose "Load Plugin", and in the dialog box
type hep.lcd.plugin.LCDPlugin (this is case sensitive so type carefully).
Note: Java Analysis Studio tries to be user friendly by remembering the last four entries you made in each dialog box, so next time you need to enter the plugin name it should already be selected by default, or available from the drop down menu.
.
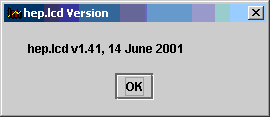
If this works successfully a new menu labeled LCD should have appeared in the JAS menu bar. To verify that everything is working you could choose Show Version from the LCD menu which should result in something like this.
The LCD extensions to JAS contain a number of tools for looking at events.
Two simple tools are the MC Particle Tree, and the MC Particle Table, both of
which can be turned on and off from the LCD menu. Before you will be able to see
anything interesting you will need to step to the first event, either by using
the Job, Step, menu item, or by pressing the ![]() button on the JAS toolbar.
button on the JAS toolbar.
Note: JAS allows you to have any number of datasets open simultaneously. They will all appear in the tree on the right under the heading "Data". At any time one of these datasets is considered to be the "Current Dataset". The current dataset can be selected by "Right Clicking" on the icon corresponding to the dataset in the tree, or by selecting the dataset from the dropdown list in the JAS toolbar. The Step, Go and Rewind functions always operate on the current dataset.
Once you have stepped to the first event and turned on one or both of the displays you should be able to see something like this.
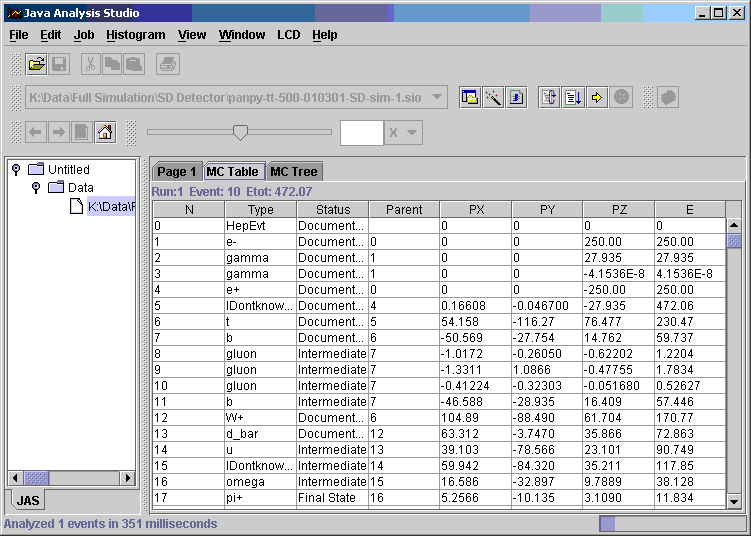

The LCD tools also contain a simple event display. Although this event display is still sometime useful it has now been largely superseded by the much more powerful WIRED event display described below.
The WIRED event display is an experiment-independent Java-based event display
developed at CERN. It has a lot of functionality built in and is easy to
customize. A version of the WIRED event display customized for LCD was installed
automatically when you installed JAS. To load it you must load the LCD/WIRED
plugin, which you do by selecting Job, Load Plugin, and typing hep.lcd.wired.application.LCDWired.
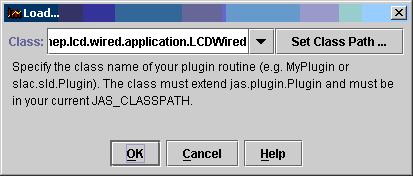
You should now have a WIRED menu item in addition to the LCD menu item. The WIRED menu contain a single command, New View, which opens a WIRED window to view the current event. As before you control which is the current event by selecting a Current Event Source and stepping through it event-buy-event using the Step command. When you use fully simulated data the detector geometry displayed by WIRED is derived automatically from the geometry used to simulate the event.
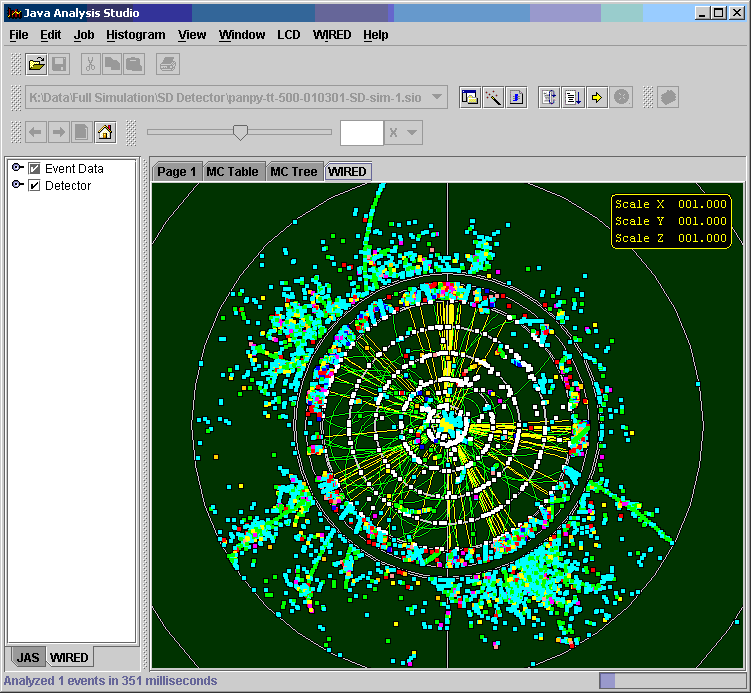
You can control the WIRED event display in three ways:
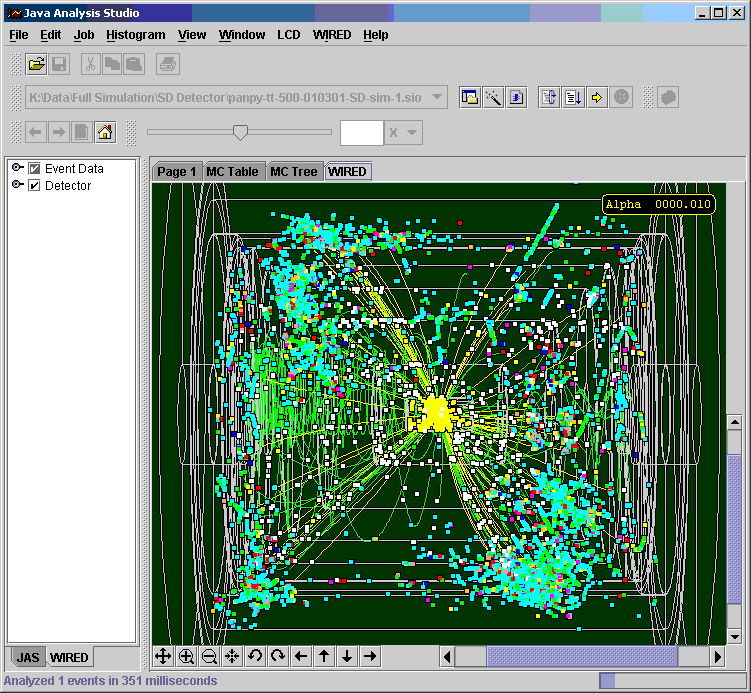
The WIRED event display has too many features to describe in detail here, but if you experiment you should be able to figure it out for yourself.
Note: If you look in the Wired tree, you will notice two entries for MC tracks, one labeled "flipped". This is because there is a bug in the Gismo simulation used to generate events, which causes Gismo to swim MC tracks as if they had their sign flipped. If you want the MC particles shown on the Wired event display to actually go through the hits, you will need to turn on the "flipped" MC tracks. This will be fixed at some point in the future.
When you are done playing with the event display you are ready to proceed to the next tutorial.