[Feedback][Tutorial Contents][Welcome Page]
![]()
These instructions assume that you have already successfully completed the first two tutorials in this series.
In this example we will read some generator level events and make a few simple histograms. We will show the mechanics of running an analysis in JAS first, and in the next tutorial will give a slightly more detailed explanation so that you will be able to write your own analysis jobs.
The first thing to do is to open a new Job and attach some data to the Job.
Choose Job, New Job, and select "Local Job for Data
Analysis" and click Next. On the next screen select "Stdhep
File", Next. Finally use the Browse button, navigate to the Data/Generator
Level/paZH directory on the CD, and select the file panpy-ZH-500-001001-gen-1.stdhep,
and press Finish.
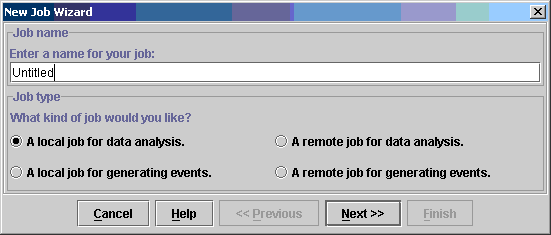
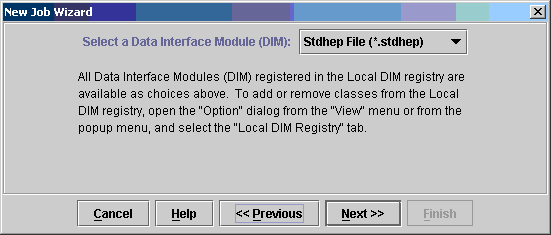
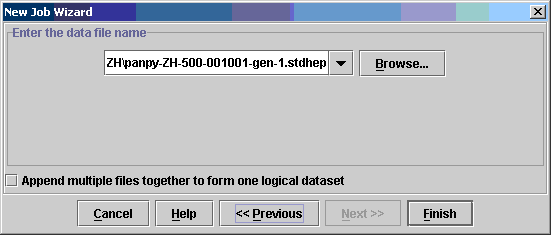
You now have a data set open, so now we have to load some analysis code. Next we have to create some analysis code. Choose File, New, Blank Program Page. The JAS Editor should now be open, with a blank document. Copy the following program into the editor.
import hep.analysis.*;
import hep.physics.*;
import hep.lcd.util.driver.*;
import hep.lcd.event.*;
import java.util.*;

public class MyAnalysis extends Driver
{
   // Called by the framework to process each event
   public void process(LCDEvent event)
   {
      // Loop over the MC particles
      ParticleVector list = event.getMCParticles();
      Enumeration e = list.particles();

      double etot = 0;
      while (e.hasMoreElements())
      {
         MCParticle mc = (MCParticle) e.nextElement();

         // histogram particle energy
         double energy = mc.getEnergy();
         histogram("Particle Energy").fill(energy);

         // reject non final state particles
         histogram("Particle Status").fill(mc.getStatusCode());
         if (mc.getStatusCode() != mc.FINALSTATE) continue;

         // reject neutral particles
         ParticleType type = mc.getType();
         int charge = (int) type.getCharge();
         histogram("Particle Charge").fill(charge);
         if (charge == 0) continue;

         // Some more histograms
         String name = type.getName();
         histogram("Particle Type").fill(name);
         // Create a folder for each particle type
         HistogramFolder.setDefaultFolder("/"+name);
         histogram("Energy").fill(energy);
         HistogramFolder.setDefaultFolder("/");

         etot += energy;
      }
      histogram("Etot").fill(etot);
   }
}
Now select File, Save and you will be prompted to store the file. Store the
file into a new empty directory with the name MyAnalysis.java. (Note:
Java requires that the filename by the same as the name of the class defined in
the file. Java is also case sensitive).
You can now compile the file by selecting File, Compile. The
console at the bottom of the JAS window will show the output from your
compilation. Hopefully there were no errors. Next we need to load the analysis
routine. Choose Job, Load Program. In the dialog type MyAnalysis
and press OK.

Almost certainly an error message will appear telling you the program could
not be loaded. In this case you will need to dismiss the error, and the choose Job,
Load Program again. This time press the Set Class Path..., button
which is used to tell JAS which directories to search for your analysis code.
Use the New Item ![]() button to bring up the directory browser, and select the directory where you
stored your analysis routine.
button to bring up the directory browser, and select the directory where you
stored your analysis routine.

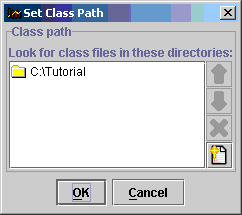
Now return to the Load dialog, enter MyAnalysis again, and this
time your program should load successfully. A new icon representing the loaded
program will appear in the tree on the left of the JAS window.
Once your analysis routine is loaded you are ready to run your analysis.
Choose Go from the Job menu, or press the Go button (![]() ),
and your analysis job should begin. You will see the progress box in the bottom
right corner of the main window indicate how far the analysis has proceeded (
),
and your analysis job should begin. You will see the progress box in the bottom
right corner of the main window indicate how far the analysis has proceeded (![]() ).
If you have selected a file containing a large number of events the analysis may
take a long time, in which case you can stop the analysis at any point by
pressing the Stop button (
).
If you have selected a file containing a large number of events the analysis may
take a long time, in which case you can stop the analysis at any point by
pressing the Stop button (![]() ).
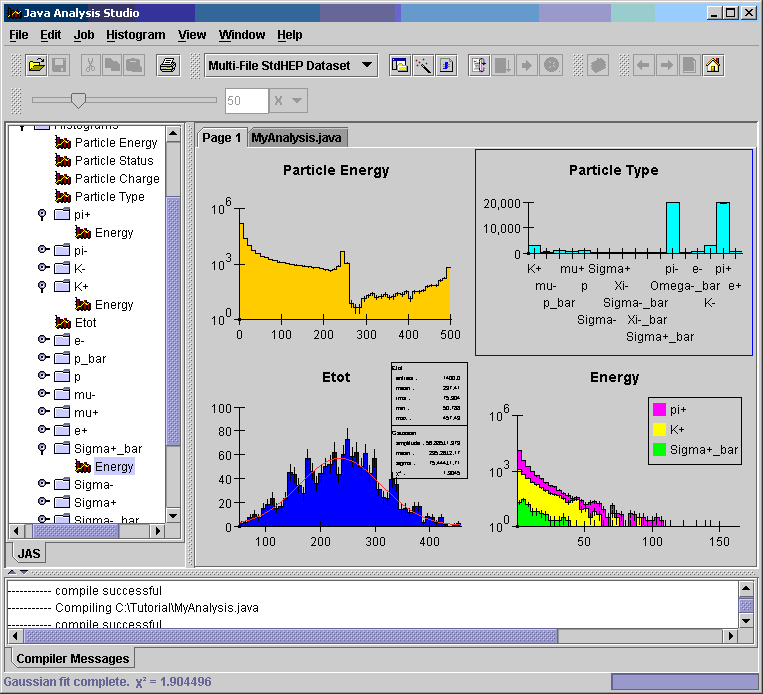
A histogram folder should now appear in the JAS tree containing all of the
resulting histograms. You can double-click on any icon to display the
corresponding histogram.
).
A histogram folder should now appear in the JAS tree containing all of the
resulting histograms. You can double-click on any icon to display the
corresponding histogram.
Java Analysis Studio supports many features for viewing and manipulating histograms, for example you can:

At this point you may well be thinking, "this is all very well, but what did all that code I had to cut and paste do, and how would I know how to change it to produce my own analysis code". All will be explained in the next tutorial.