 Tutorial Tutorial
These instructions assume you have successfully completed JAS Tutorial Part 4: Compiling, Loading and Running your Source Code.
In part 4 you compiled, loaded and ran your source code. This tutorial details the process for viewing the results of the procedure.
To view a histogram or scatter plot you need to select a plot page on the main JAS display panel and add the histogram or scatter plot by selecting it from the job tree.
To display the first histogram created in part 4:
To overlay the second histogram created in part 4:
|
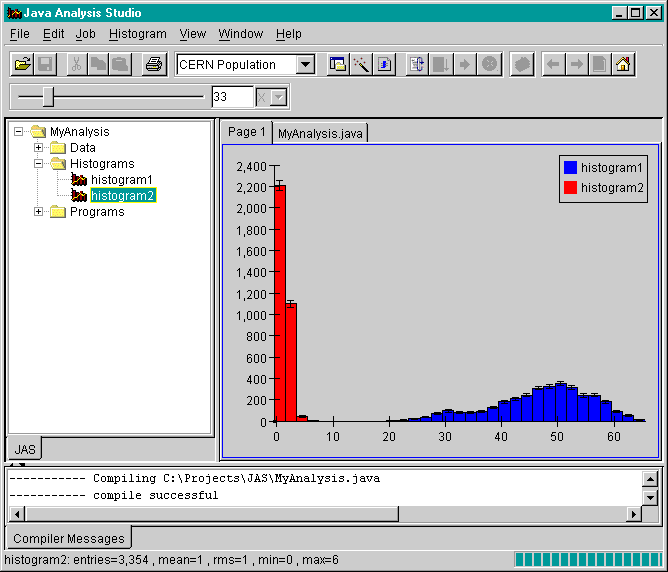
With the histograms displayed on Page 1, the JAS display should look similar to the image shown below:
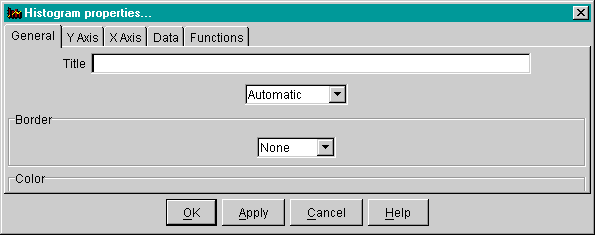
You can modify the way the plot looks modifying the fields of the various panes in 'Plot Properties' dialog shown below. The properties dialog can be generated by:
Congratulations!! You have processed a local job for data analysis! You should now save your JAS job for future reference.
| Save your Job by selecting 'Save Job' from the Job submenu. |
To learn about how to process other job types in JAS and some other special features of JAS proceed to JAS Tutorial Part 6: Further Explorations into JAS.