Tutorial
[Getting Started][Viewing Data][Functions][Fitters][The
Default Fitter][Registries][Class
Paths][Analyzing Data]
See also the step-by-step example.
Getting Started
- Create a new job by selecting 'New Job...' under the 'File' menu.
In the dialog that will pop up, specify the server where your data are stored, and
a name for your job.
- To open data stored on that server, select 'Open Data Set...' from the 'Job' menu.
- Once you have saved your job, you can open it from the 'Recent Jobs' submenu in the
'File' menu. Also, you can have Java Analysis Studio automatically open your most
recent job. To do so, select 'Open last job at startup' from the 'Options' dialog.
Viewing Data
- The program opens with a single page entitled 'Histogram'. To create new histogram
pages, select 'Histogram Page' from the 'New' submenu in the 'File' menu. A page can
have multiple histograms; choose the style you want on the 'Histogram Page' submenu.
- To view a histogram, select the plot you want it to appear on by clicking the mouse
inside it. A blue frame indicates the selected plot. To add the histogram,
select the data set in the job tree, as shown below.
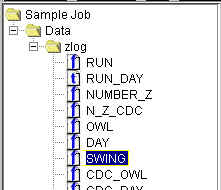
Either double click on the data name, or select 'Show Data' from the 'Histogram' menu.
To overlay another data set, select it on the job tree as show in the illustration
above, and select 'Overlay Data' from the 'Histogram' menu.
Functions
Java Analysis Studio comes with a number of default
functions that can be displayed on a plot. Most of these functions are fittable.
To define your own functions, see the documentation
provided. Java Analysis Studio keeps a function registry where it holds all of the
functions that can be added to a plot. The first time you use Java Analysis Studio,
these default functions will be registered. If
you wish to add or remove functions from this list, see the documentation below on changing the function and fitter registries. Your
modifications to the function registry will be saved and loaded next time the application
starts if you have selected the 'Save registries' box in the 'Options'
dialog. By default, this option is selected. To use functions in data
analysis,
- Select the plot you want to add a function to by clicking the mouse on that plot.
A blue frame indicates the selected plot.
- You can add a function to the plot in three ways. The first way is to select the
'Add Function' submenu from the popup menu. You will
see a list of the functions in the function registry. Select one and it will be
added. The second way is to access the same 'Add Function' submenu, which is also
located in the 'Functions' submenu of the 'Histogram' menu. The third way is to open
the 'Properties' dialog from either the popup menu or the
'View' menu. Select the 'Functions' tab, and click on the 'Add' button.
- Some functions have advanced options. These are options specific to a certain
function, such as a spline function's smoothness or a polynomial function's order.
The 'Advanced Options...' button on the 'Functions' tab of the 'Properties' dialog is
active when one such function is selected. Click it to open a dialog box that allows
you to set special options for the selected function. See the documentation on advanced
options for more information on defining a function that allows the user advanced
options.
- There are three ways to fit a curve to data. The first way is to select the 'Fit'
submenu from the popup menu. The 'Fit' submenu will
only be active if there is at least one fittable function that is not fit already and one
data set on the selected plot. If there are multiple data sets, you will first be
asked to select which one you want the curve to be fit to. You will then be asked
which curve you want to be fit to that data set. The second way is to access the
same 'Fit' submenu from the 'Functions' submenu of the 'Histogram' menu. When a
fitter that was executed in these two ways is finished, the chi squared value for the fit
will be displayed in the lower left corner of the application frame. To look at the
parameters of the fit after fitting a curve in either of these two ways, you will have to
select the 'Functions' tab on the 'Properties' dialog and
select the function you have just fit. The parameters are displayed on a table
there. The third way to fit a curve to data is to select the 'Functions' tab on the 'Properties' dialog, and select the 'Fit' check box. The
check box will only be enabled if a fittable function has been selected. The new fit
parameters visible are on the same pane.
The fitter should stay linked to the data as you have set it and should re-fit the
curve each time the data change. If the function has handles and you move one of
them manually, the fit will be cleared and will no longer update with the data.
Fitters
Java Analysis Studio comes with a least-squares fitter. Like functions, fitters
are stored in a registry and you can add and remove fitters from the registry. Like
for the function registry, the fitter registry will be saved and loaded next time the
application starts if the 'Save registries' box in the 'Options'
dialog is selected, which it is by default. To define your own fitter, see the documentation. The next section describes how to add and remove functions from
their registries.
The Default Fitter
If you try to fit a function from the 'Fit' menu (as opposed to fitting from the
'Properties' dialog) the program will use the default fitter. To set or view the
default fitter, select the 'Defaults' tab on the 'Options'
dialog and select the fitter there.
Changing the function and fitter registries
The registries are accessible from the 'Options' dialog.
In one of the 'registry' panes, click on the add button (fourth down) to add a
class to the registry, and on the remove button (third down) to remove the selected
class. Only classes that extend jas.hist.Fitter can be added to the fitter
registry. Only classes that extend jas.hist.Basic1DFunction or classes that
implement jas.hist.FunctionFactory can be added to the function registry. Be sure
that the fitter or function is a class in your class path. See the next section for adjusting class path. The function registry
is shown is the 'Options' dialog below.
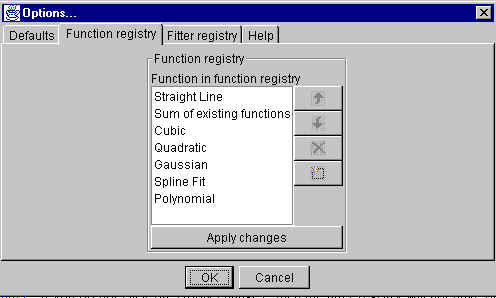
The 'Apply changes' button causes the registry to adopt your changes immediately.
(Clicking on 'OK' does the same thing before closing the dialog.) The 'Apply
changes' button is useful if you have recently added a fitter and you wish to make it the default fitter. If you do not click on 'Apply changes',
then the fitter registry will not have been updated with the new fitter and it not be a
choice for the default.
Class Paths
When Java Analysis studio searches for a class, it looks in your class path.
This is just a set of default directories where it looks for classes. To set or view
your class paths, go to the 'Defaults' tab of the 'Options'
dialog and set them the same way you set the function and fitter registries. The
arrow buttons change the order in which the directories are searched.
Analyzing data
Java Analysis Studio allows you to define your own analysis routines. You can
load any Java class that is properly defined to run an analysis on the data. The
following guidelines must be followed:
- Select a name for your analysis routine.
- Create a file with the analysis name and a '.java' extension. For example, if your
analysis routine were called 'MyAnalysis' then the file would have to be called
'MyAnalysis.java'. You can create or edit this in any text editor, or in Java
Analysis Studio itself. To create a new file, select 'Program' from the 'New'
submenu of the 'File' menu. To open an existing file, select 'Open...' from the
'File' menu or click on the 'Open' button on the toolbar.
- In that file, define a public class and give it a public constructor with no arguments.
Your class must extend hep.analysis.EventAnalyzer.
- Import hep.analysis.*.
- Add some private instance variables to your class and initialize them in your
constructor. For example, you may want a histogram to store the results of your
calculations. In that case, your class so far might look like this:
import hep.analysis.*;
public class MyAnalysis extends EventAnalyzer
{
private Histogram result;
public MyAnalysis()
{
result = new Histogram("Result");
}
}
Whatever histograms you instantiate will be listed on the job tree on the left of
the application window. They can be viewed as they are generated. Histograms
can be sorted into folders (class hep.analysis.HistogramFolder).
In fact, folders can be stored in other folders.
- Override the following method:
public void processEvent(EventData ed)
In this method, perform calculations on a particular event. For example, if your
result is the product of mass, energy, and pi, your method definition should be:
public void processEvent(EventData ed)
{
result.fill( Math.PI * ed.getDouble("MASS") *
ed.getDouble("ENERGY") );
}
The method processEvent will be called for each event once
you tell the program to begin executing it. Thus, your result histogram will contain
one entry for each event, and will contain values as defined in the processEvent method.
- There are other methods you may wish to take advantage of.
public void beforeFirstEvent()
If there is anything you want to have done just before the program begins, override this
method and include in it those things you want done before the first event.
Otherwise, do not override it.
public void afterLastEvent()
Similarly, override this method if you want to do something after the analysis is
complete. Often the sendMessage(String) method is used here.
public void sendMessage(String message)
This outputs a string in the lower left corner of the application frame.
Now, you can compile the file. You could use Sun's Java Development Kit compiler
at the command prompt. For example, I would type
javac MyAnalysis.java
Alternatively, you can compile it in Java Analysis Studio by clicking on the 'Compile'
button on the toolbar. You still must have
downloaded the Java Development Kit from Sun in order to
get the compiler. Be sure to save the file before compiling. Either way, you
get a class file from your source file. In my example, it would be called
'MyAnalysis.class'.
To load the program, select 'Load...' from the 'Job' menu. Do not type any
extension. In my example, I would just type 'MyAnalysis'.
To run the program, click on the 'Run' button on the toolbar.
You are visitor number  .
.
Page maintained by Jonas Gifford.
Last updated 01/14/04.