Step-by-step example
In this example, we will go from beginning to end through a typical execution of Java
Analysis Studio. See the tutorial for a more detailed
how-to guide to Java Analysis Studio.
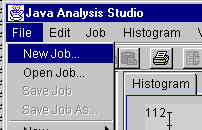
- First, you need a job. To create a new job, select 'New
Job...' from the 'File' menu.
A dialog will open. In it, select the server where your data are and a name for your
job.
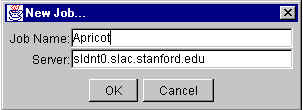
I have chosen to call mine 'Apricot'. The server sldnt0.slac.stanford.edu is the
default choice on this dialog. It has a variety of sample data sets on it.
- Next, open a data set by selecting 'Open Data Set...' from the 'Job' menu.
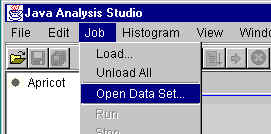
You will get a dialog that shows the data sets available on that server. On the
sldnt0.slac.stanford.edu server, I get the following dialog:
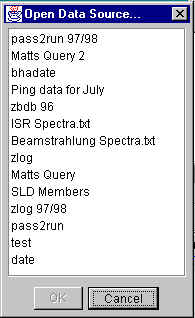
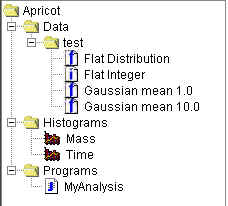
I will use the 'test' data set. Once I have selected a data set, the job tree on the
left looks like this once opened:
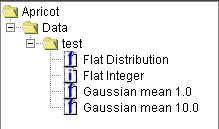
The four entries in the 'test' data set each represent a particular measurement or
quantity for a set of events. They each have the same number of events (data
values). The numbers in this set are random and meaningless, but in principle, you
would want to create an analysis routine that considered all of the data one event at a
time, calculate one or more results for each event, and store those results in one or more
histograms. That is exactly what we will do in this tutorial.
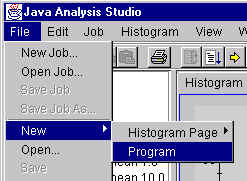
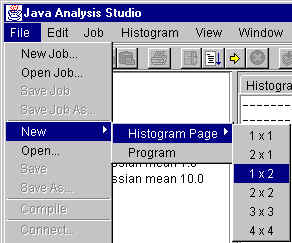
- Now you will want to write your customized analysis routine. You can write it in
any text editor, but you may wish to use the Java Analysis Studio text editor. To
create a new page for writing a file, select 'Program' from the 'New' submenu in the
'File' menu.
If you already have a text file, you can open it by selecting 'Open...' from the 'File'
menu, or by clicking on the 'Open' button on the toolbar.
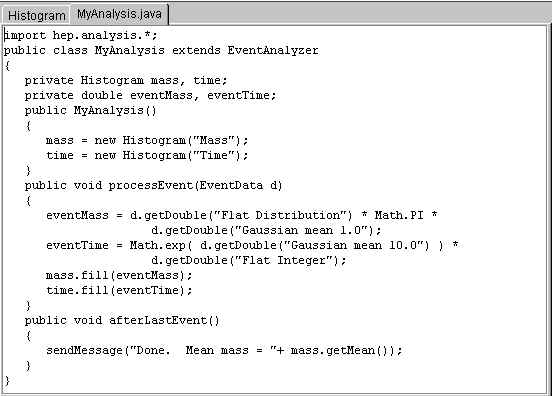
- To write a suitable class, you must follow some guidelines. See the guidelines for using analysis classes on the main
tutorial page. In my example, I have created a program in a class called
MyAnalysis.java that calculates two quantities: mass and time. I have assumed that
mass is the product of the flat distribution, pi, and the Gaussian mean 1.0, and that time
is the product of e to the power of the Gaussian mean 10.0 and the flat
distribution. Of course, these calculations are meaningless, but they illustrate how
a typical analysis routine is done. In the snapshot below is the code I wrote in
the Java Analysis Studio text editor.
- You must compile your '.java' file into a '.class' file. Were I to use the Java
Development Kit's compiler directly, I would type
javac MyAnalysis.java
at the command prompt. Java Analysis Studio has a build-in compiler option. You
must download the Java
Development Kit from Sun in order for the compile option to work. To
use it, first be sure you have saved the most recent version of your file. To save,
use the icon on the toolbar or select 'Save' from the 'File'
menu. To compile, click on the compile icon on the toolbar.
This will generate a new tabbed pane called 'Output'. When I compiled my
code, the output was as below.
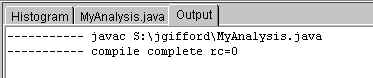
The statement rc=0 indicates successful compilation; rc=1 indicates at least one error. A dialog box will come
up if an error occurred in compilation so you do not need to keep going back to the
'Output' pane to determine whether the compilation was successful.
- To load the class, select 'Load...' from the 'Job' menu. On that dialog box is a
button where you can set your class paths. The
new class file must be in one of the directories specified by your class path. Enter
the name of the class without the file extension. In my example, I entered
'MyAnalysis'. The job tree is now complete with the program I loaded and the and new
histograms that it created.
- I now want to set up my display. I want to view the two results histograms as they
form. I will make a new histogram page with two plots as follows:
The resulting page has two histogram plots:
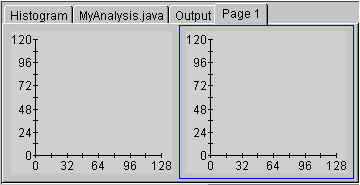
The blue frame indicates the current plot. Double click on the histogram entry on
the job tree to assign it to the selected plot. Of course, the histograms are both
empty so nothing significant will show in the plots.
- There are two ways to run the analysis. The most common way is to use the 'Go'
icon on the toolbar. That will run the analysis for all of
the events. Alternatively, you can run the analysis using the 'Step' option, also an
icon on the toolbar. That will analyze only the next one
event. You can watch your histograms form as each event is analyzed. Click on
the 'Rewind' button in the toolbar to start at the beginning
again.
Page maintained by Jonas Gifford.
Last updated 01/14/04.