A sample physics analysis using ClusterID
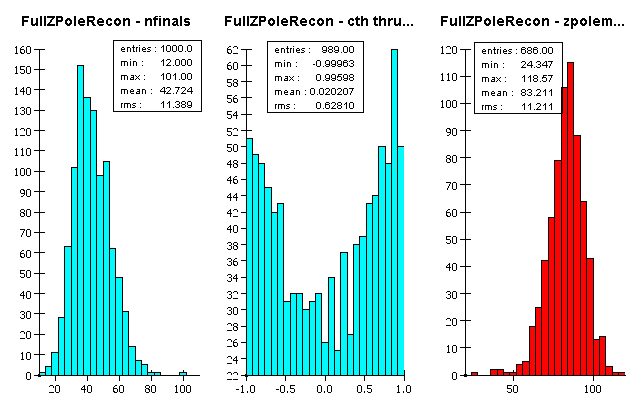
For our example we will reconstruct the Z mass in e+e- events at 91GeV in the LCD SD detector. This will reproduce the ClusterID Z mass plot shown elsewhere (with a different title) in the ClusterID Overview and Performance pages.
The reader is assumed to already be familiar with using JAS/LCD for analysis. If not, please go to the Java Analysis Studio home page to learn how to use JAS and then to the LCD home page to learn how to use JAS to do analysis with LCD data.
The reader should be familiar with the standard basic pattern for using JAS to do LCD physics analysis. The user creates a top level class (program) which is an extension of the Driver Class which defines the eventloop, i.e., the set of processors that will manipulate the data in the simulated physics event. This usually involves a series of processors that are part of the LCD code system followed by the user's own special processor to do the desired analysis.
Here is the Driver class for our example:
Here is the "user" analysis code.
You should get plots that look something like this: