The program opens with a single page entitled 'Page 1'. To create new histogram
pages, select 'Histogram Page' from the 'New' submenu in the 'File' menu. A page can
have multiple histograms; choose the style you want on the 'Histogram Page' submenu.
To view a histogram or scatter, select the plot you want it to appear on by clicking the
mouse inside it. A blue frame indicates the selected plot. To add the
histogram or scatter plot from one of the open data sets to
the selected plot, select the data set in the job tree, as shown below. Histograms
and scatter plots generated from event analyzers or event generators are in a tree folder
called 'Histograms'.
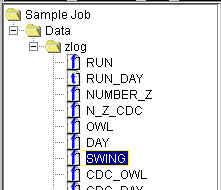
To show the selected histogram in the selected plot and remove all other data showing on
it,
double click on the selected tree node, or
select 'Show Data' from the 'Histogram' menu, or
open the popup menu from the selected tree item, and select
'Show Data'.
To overlay the selected histogram on the existing data in the selected plot,
select 'Overlay Data' from the 'Histogram' menu, or
open the popup menu from the selected tree item, and select
'Overlay Data'.