[Feedback][Tutorial Contents][hep.lcd Home]
![]()
These instructions assume that you have already successfully completed tutorial 1, Installing JAS and the LCD extensions.
To start Java Analysis Studio double-click on desktop icon ![]() . If all is OK you should see a window that looks
something like this:
. If all is OK you should see a window that looks
something like this:

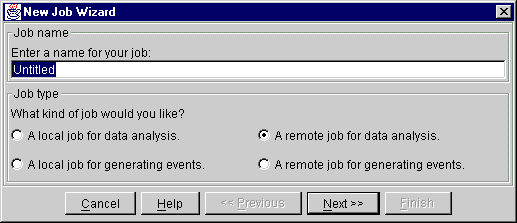
The first thing to do is to create a "Job". To do this choose "New Job" from the Job menu. In the dialog that appears choose a name for your job, and select "A Remote Job for Data Analysis" and then click next.
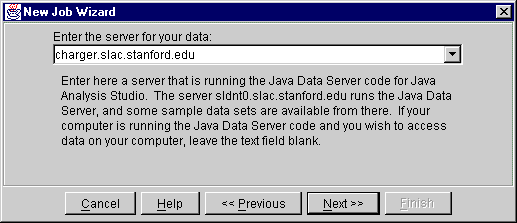
At this point you are connecting to a remote data server. We keep a selection of LCD data on the server, sldnt0.slac.stanford.edu, so type this server name into the dialog, and then click next.
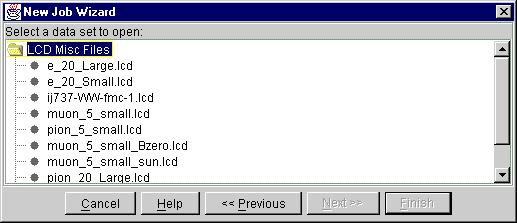
In the next window choose any LCD dataset which looks interesting and choose "Finish".
You have now created a job and opened a remote dataset. Next you want to load up the LCD specific extensions, which include the event display.
From the "Job" menu choose "Load Plugin", and in the dialog box type hep.lcd.plugin.LCDPlugin (this is case sensitive so type carefully). Note that Java Analysis Studio tries to be user friendly by remembering the last four entries you made in each dialog box, so next time you need to enter the plugin name it should already be selected by default.
If you get an error message at this point it probably indicates that you did not successfully install the LCD extensions. Do not collect $200 and fgo directly to the Troubleshooting section.
A new menu item "LCD" should now have appeared in the Menu Bar. In this menu choose "Show Event Display". An empty event display should appear.
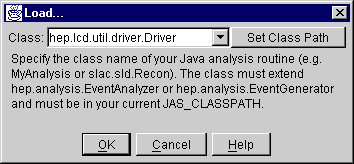
To step to the first event Java Analysis Studio requires that you define an analysis routine, even if it doesn't do anything (this is a bug and will be fixed in the next release). To define an empty analysis routine, choose "Load Program" from the Job menu and type in hep.lcd.util.driver.Driver (as always this is case sensitive).
Now press the step one event button (![]() ) and you should have an event display that looks something
like this:
) and you should have an event display that looks something
like this:
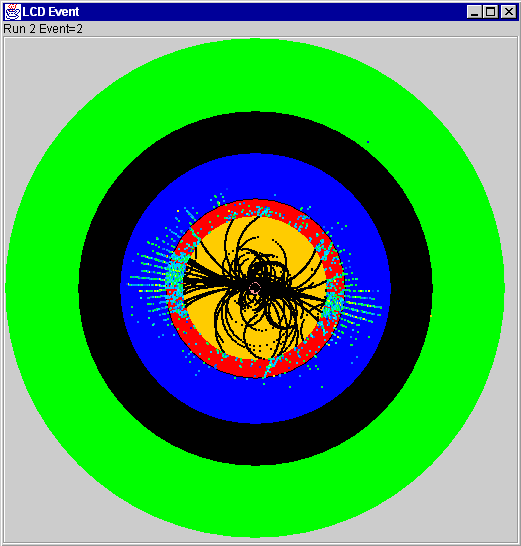
Try playing with the menus to manipulate the event display. You can zoom by dragging the mouse on the event display to outline an area and then releasing the mouse. Double click on the display to reset the zoom. You can also get an option menu by RIGHT clicking on the event display. The option menu allows you to select an XZView in addition to the default XYView. Try opening a different dataset (using the Job menu Open Dataset... menu item) and look at different detector configurations and event types. Note that the event display automatically reconfigures itself to take into account different detector geometries.